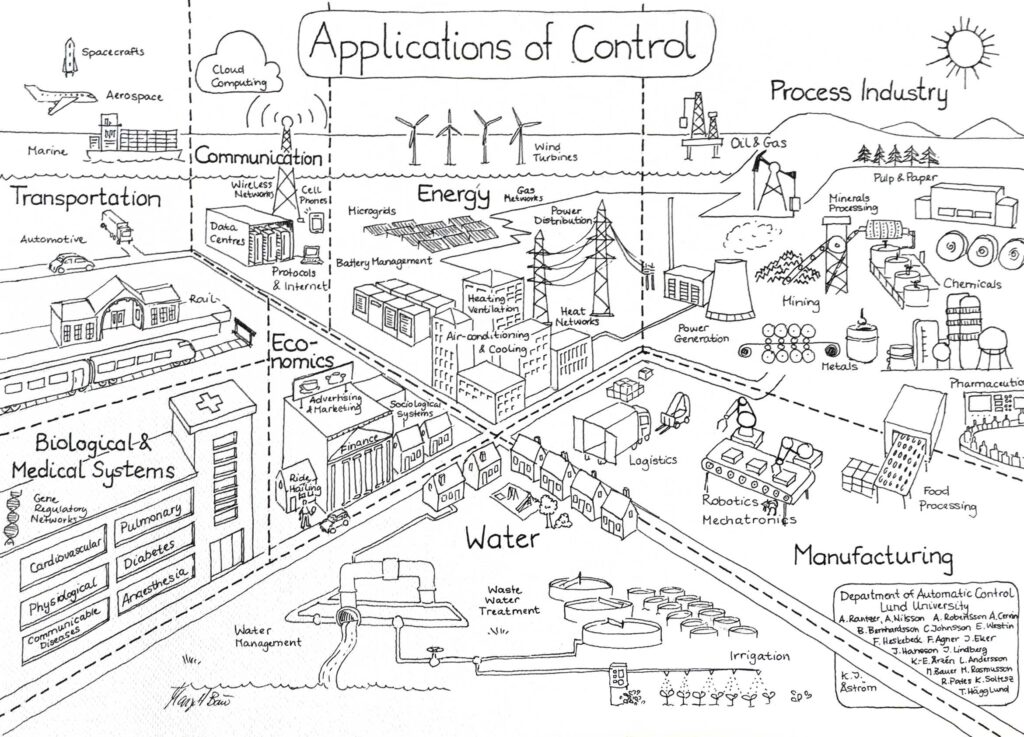
The first drawing came about as part of the Lise-Meitner-Professorship at the Department of Automatic Control at Lund University. It was inspired by Brian Douglas, who brought the control community together using his now (within the control community) very famous Map of Control Theory. To me, there are two maps, and the applications are more important to me personally. (The old research paradigm – do we start with problems or methods?).
I used the map of control applications as an introduction tool to the colleagues and Ph.D. students in the department. During the daily coffee breaks, we brainstormed industries using control and organised them on round post-it notes on the coffee room wall. Everyone could re-arrange or add the notes. Karl Johan Aström, the former head of the department contributed to the discussion and the map is dedicated to him. All the Ph.D. students and colleagues who were there are noted at the bottom.
The positive feedback from the map gave me the idea to use drawings as a communication tool. I now only draw when I need a graph: my first book on control contains only drawings and not a single diagram.
I created this webpage to put all the drawings that were done for different occasions in one place (shoutout to Dina Shona Laila at Lulea University of Technology, Sweden).
LinkedIn Posts – The State of Process Automation (2026)
Advances in PID Control, Almeria
LinkedIn Posts – Miscellaneous process control stuff